Exploring Dashboards
Now that you have projects and sites set up, let's explore the powerful dashboards.
Step 1: Navigate to Dashboards
- Expand the side panel (left sidebar)
- You'll see three main dashboard categories:
- Carbon Dashboard
- Biodiversity Dashboard
- Climate Dashboard
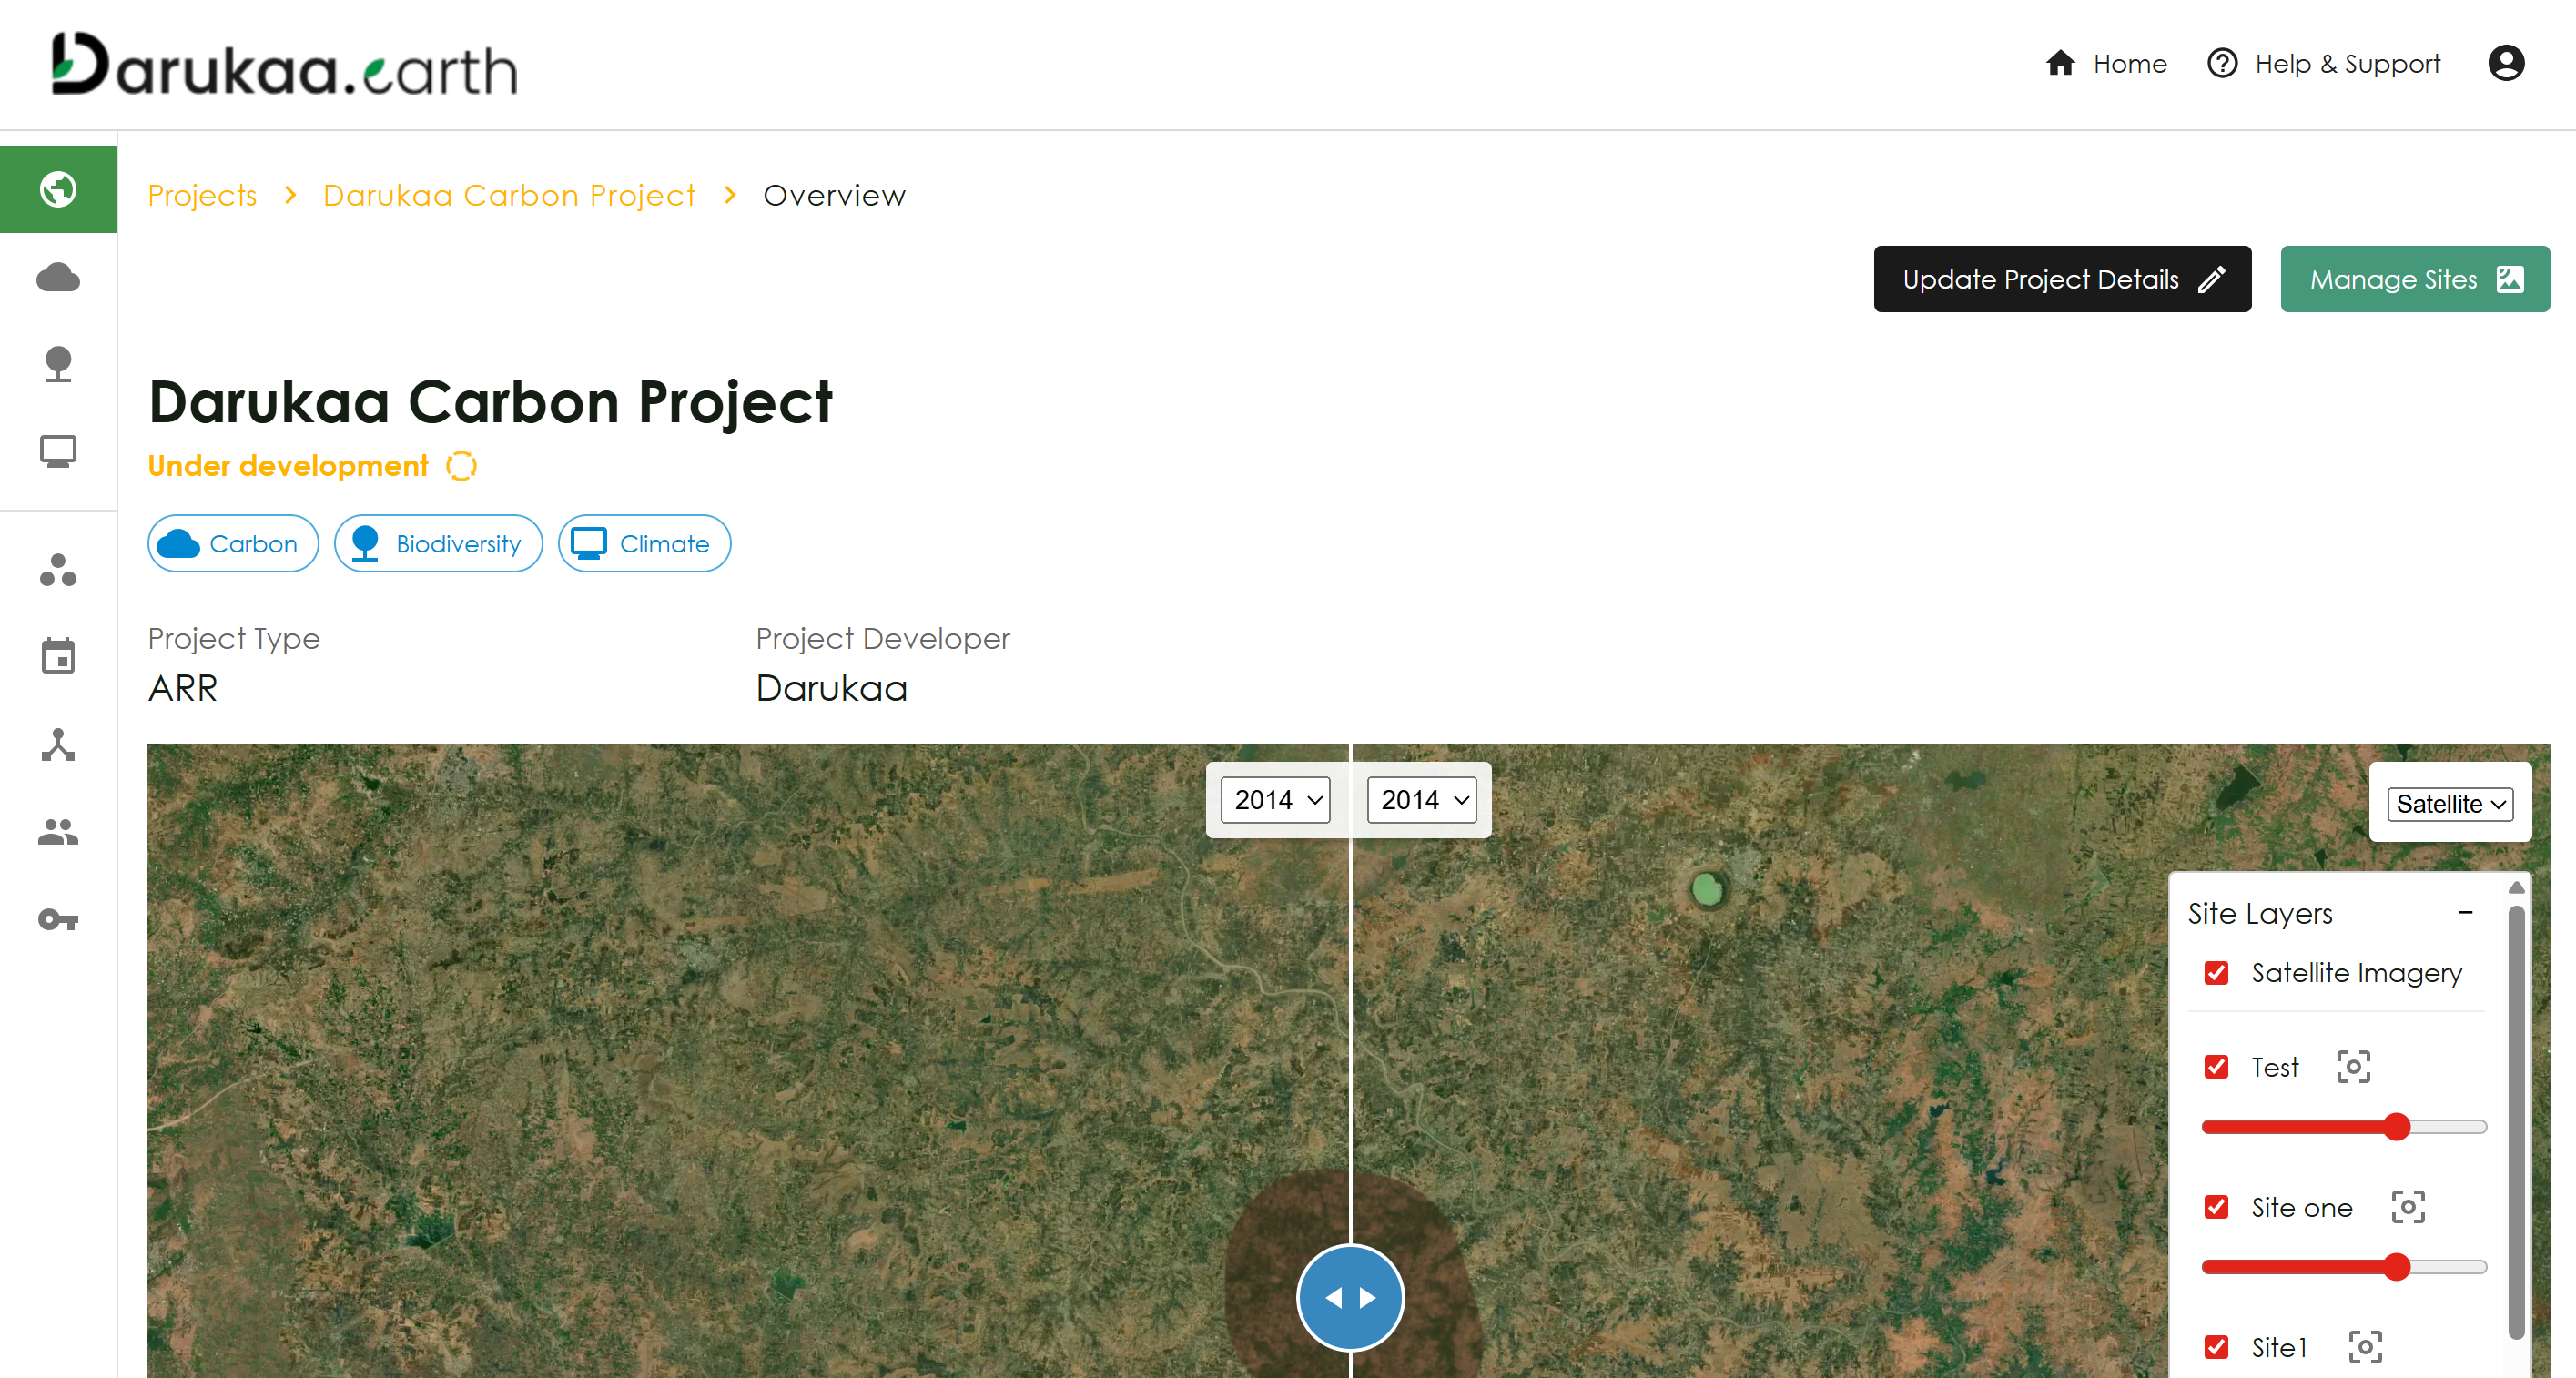
Dashboard navigation panel and overview showing Carbon, Biodiversity, and Climate modules
Step 2: Project-Level View
Project-level dashboards show aggregated metrics across all sites:
- Get a comprehensive overview of your entire project
- Compare performance across different sites
- Track trends over time
Step 3: Site-Level Deep Dive
- Click on any site to zoom into site-specific dashboards
- View detailed metrics and analytics for that specific location
- Access site-specific visualizations and charts
- Track changes over time for individual sites
Dashboard Features
Manage Sites
The Manage Sites view allows you to effectively track, edit, and organize all sites within your project.
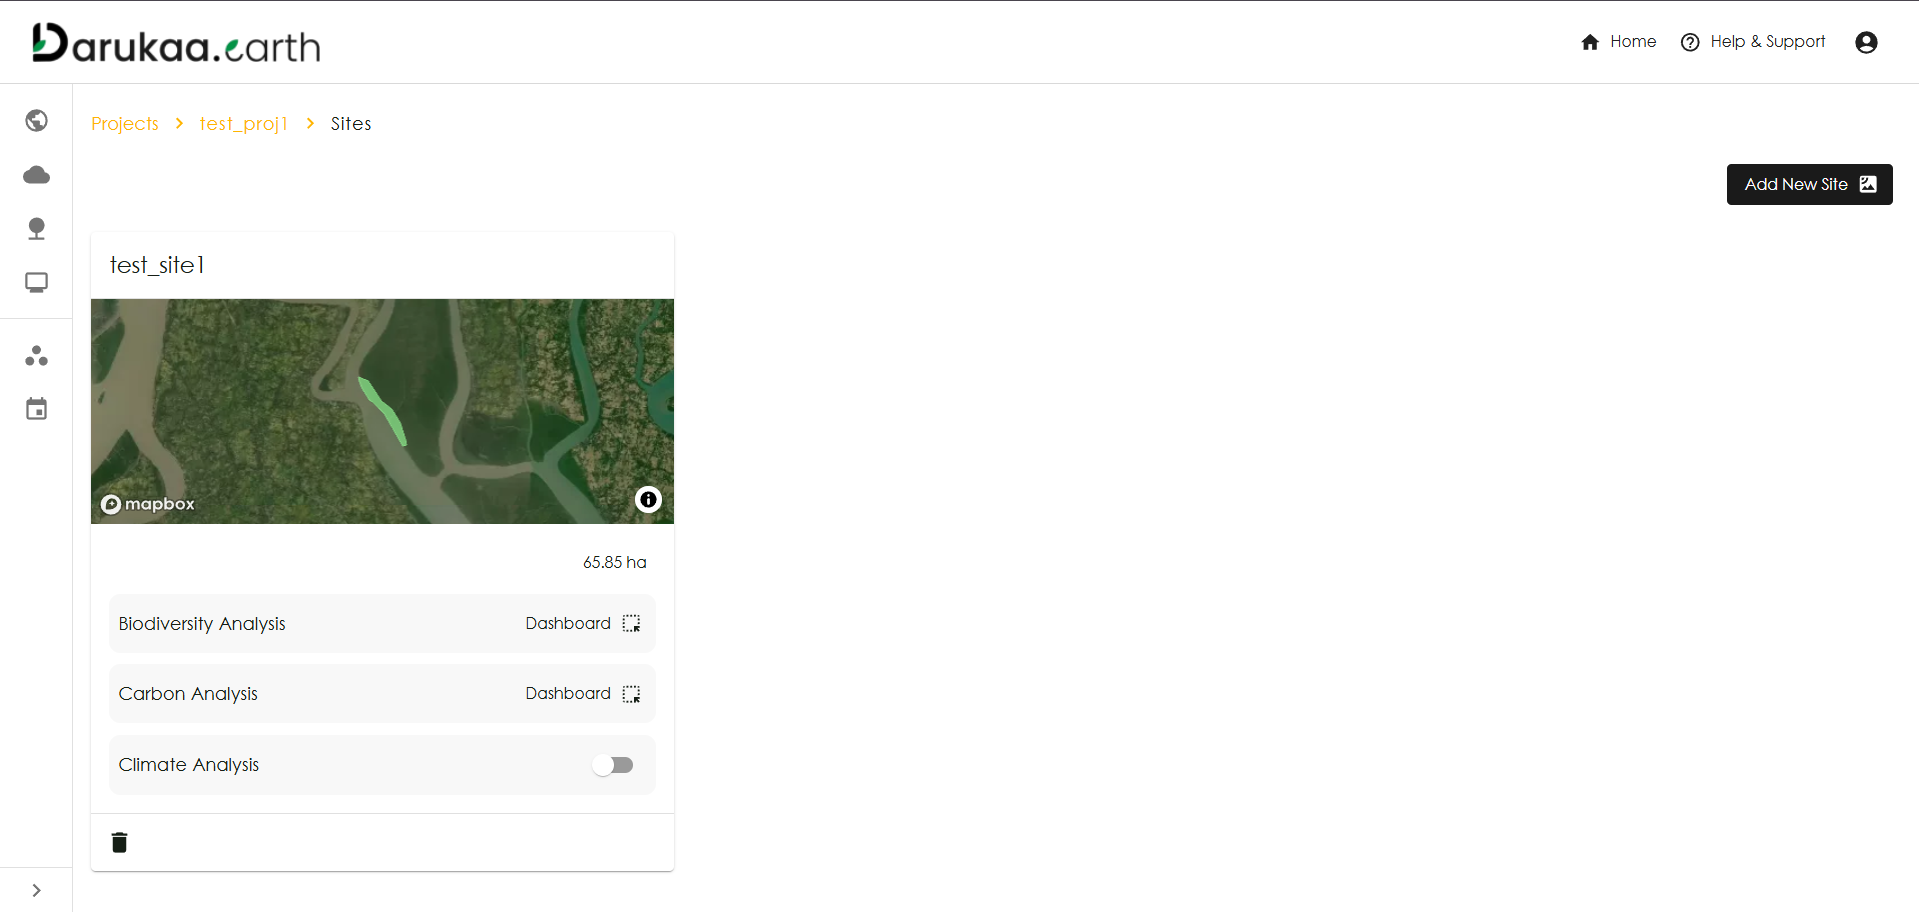
Key features include: - Site Overview: Quickly view high-level details of all configured sites. - Site Status: Monitor the active status and essential metadata of each location. - Site Configuration: Easily click through to edit boundaries or configuration details.
Carbon Dashboard
The Carbon Dashboard provides a comprehensive view of carbon-related metrics essential for climate action projects. It helps project developers track carbon stock and verify mitigation efforts.
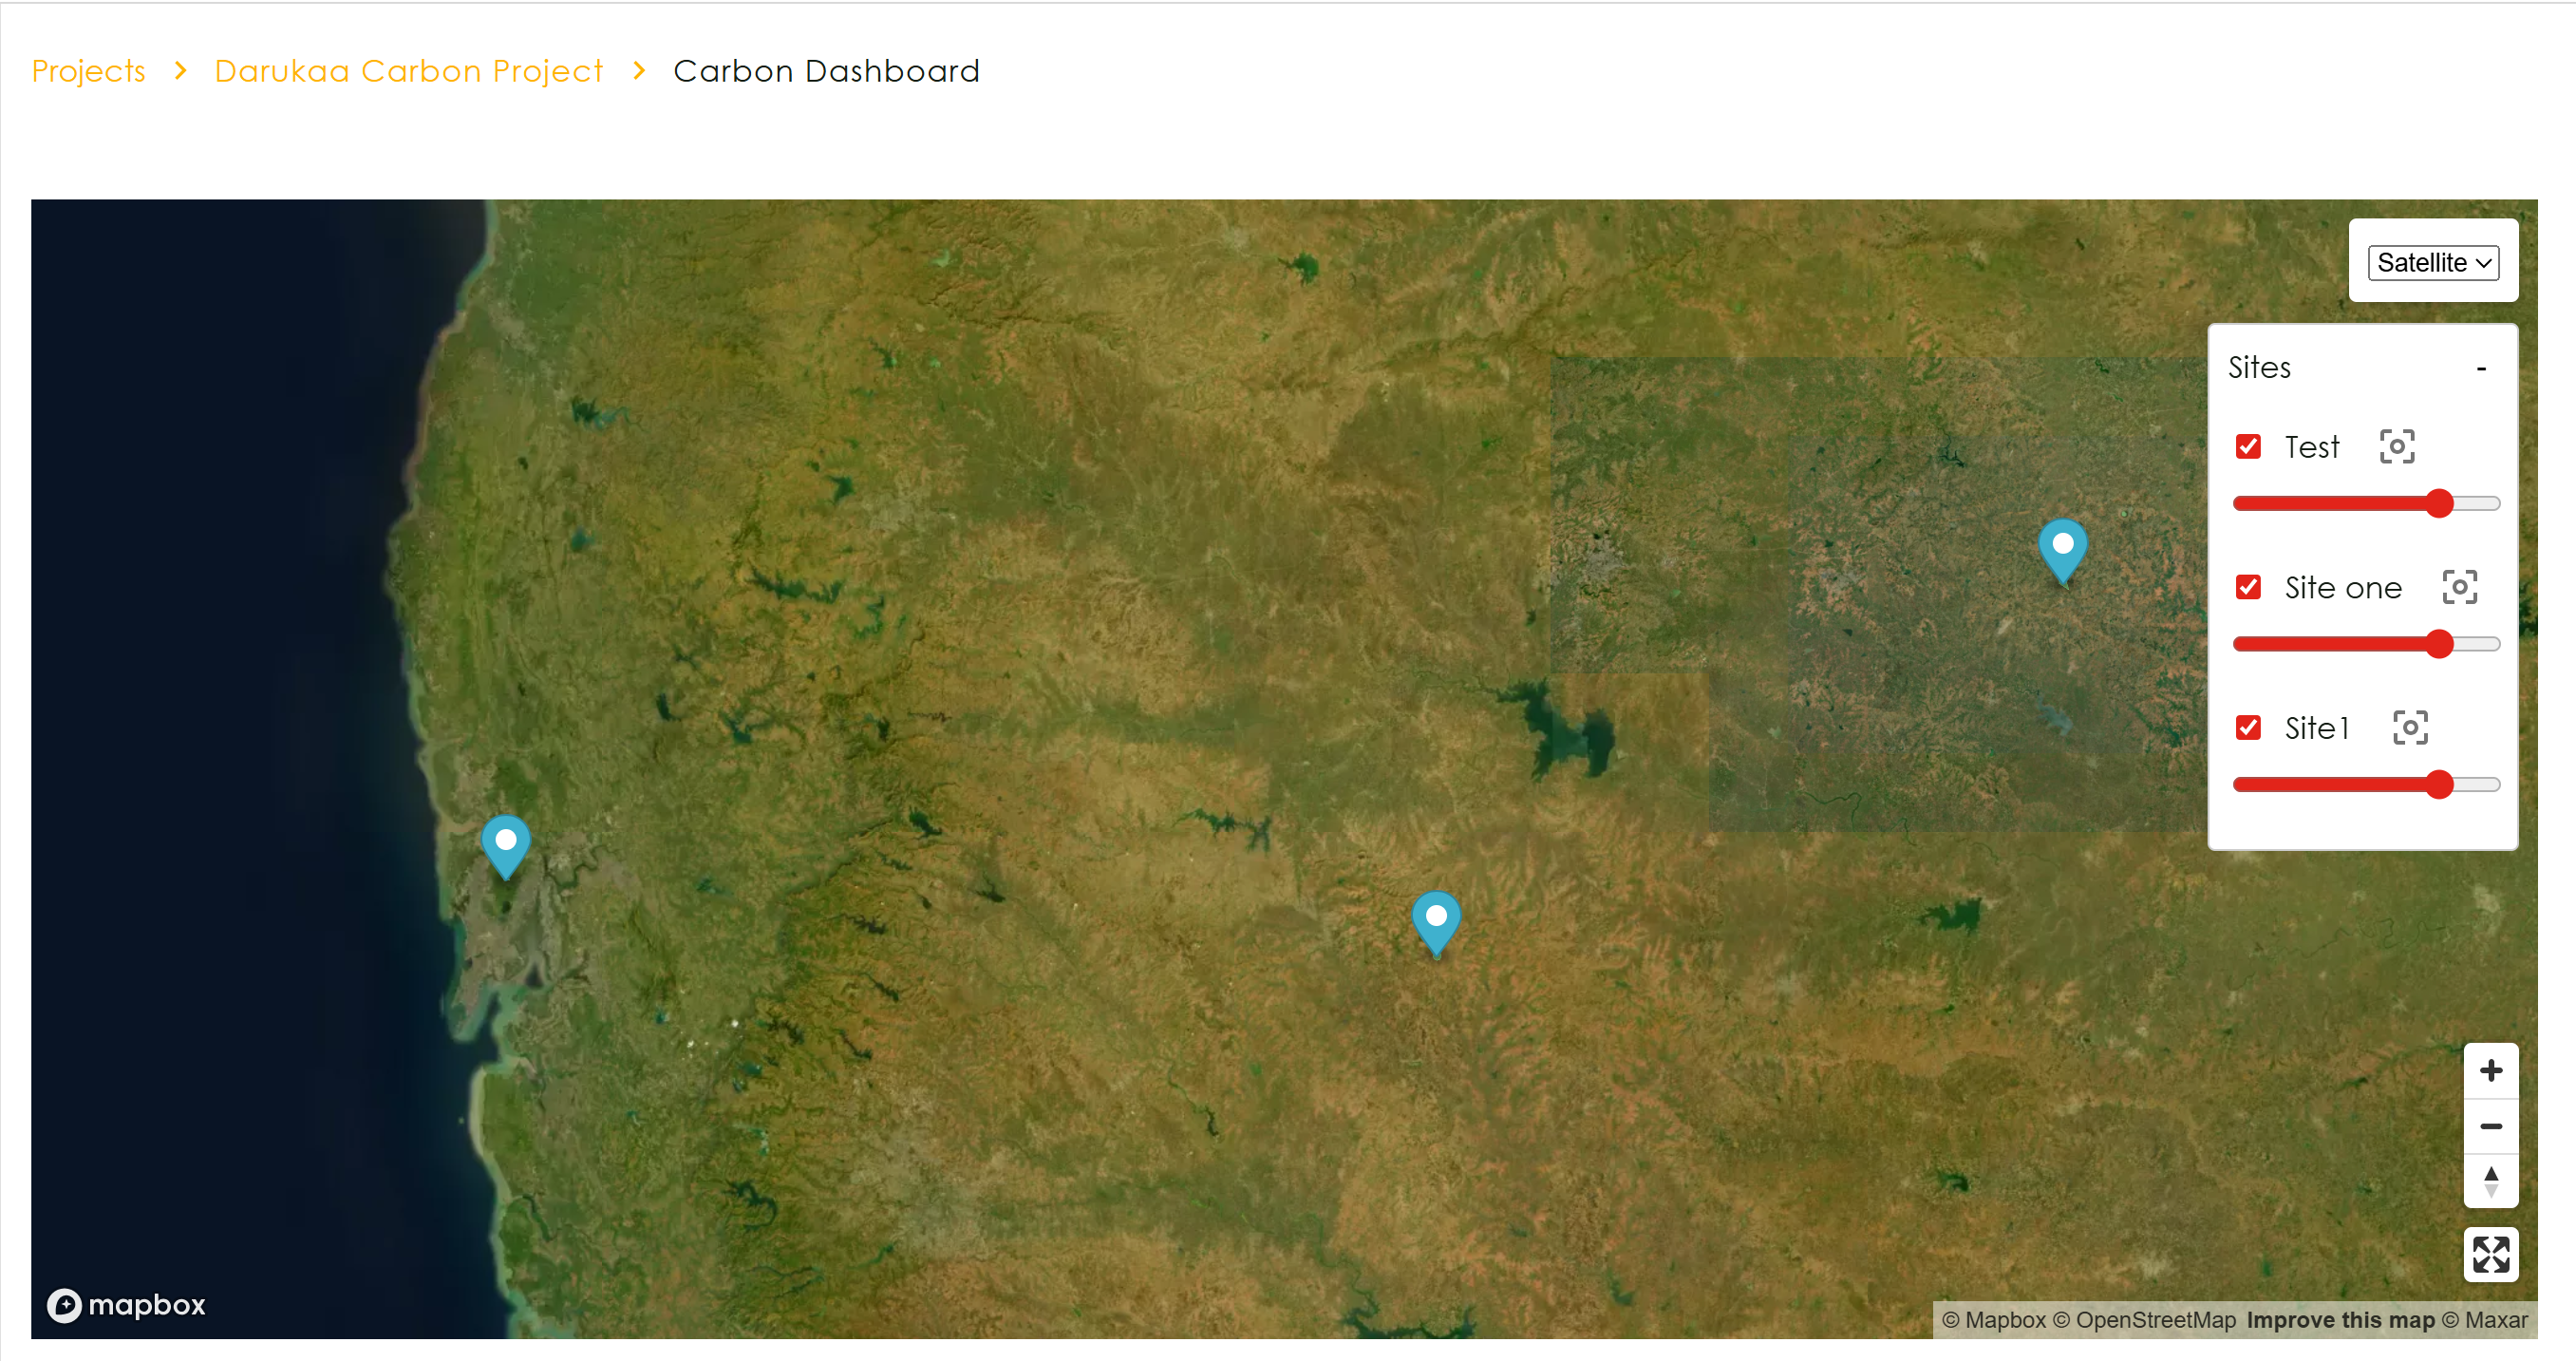
Key features include: - Biomass Analysis: Track above-ground and below-ground biomass. - Carbon Stock: Calculate total carbon stock and sequestration over time. - Land Changes: Monitor land use and land cover (LULC) changes. - Credits Eligibility: Assess potential carbon credits generation. - Soil Profiles: Evaluate soil organic carbon levels.
Biodiversity Dashboard
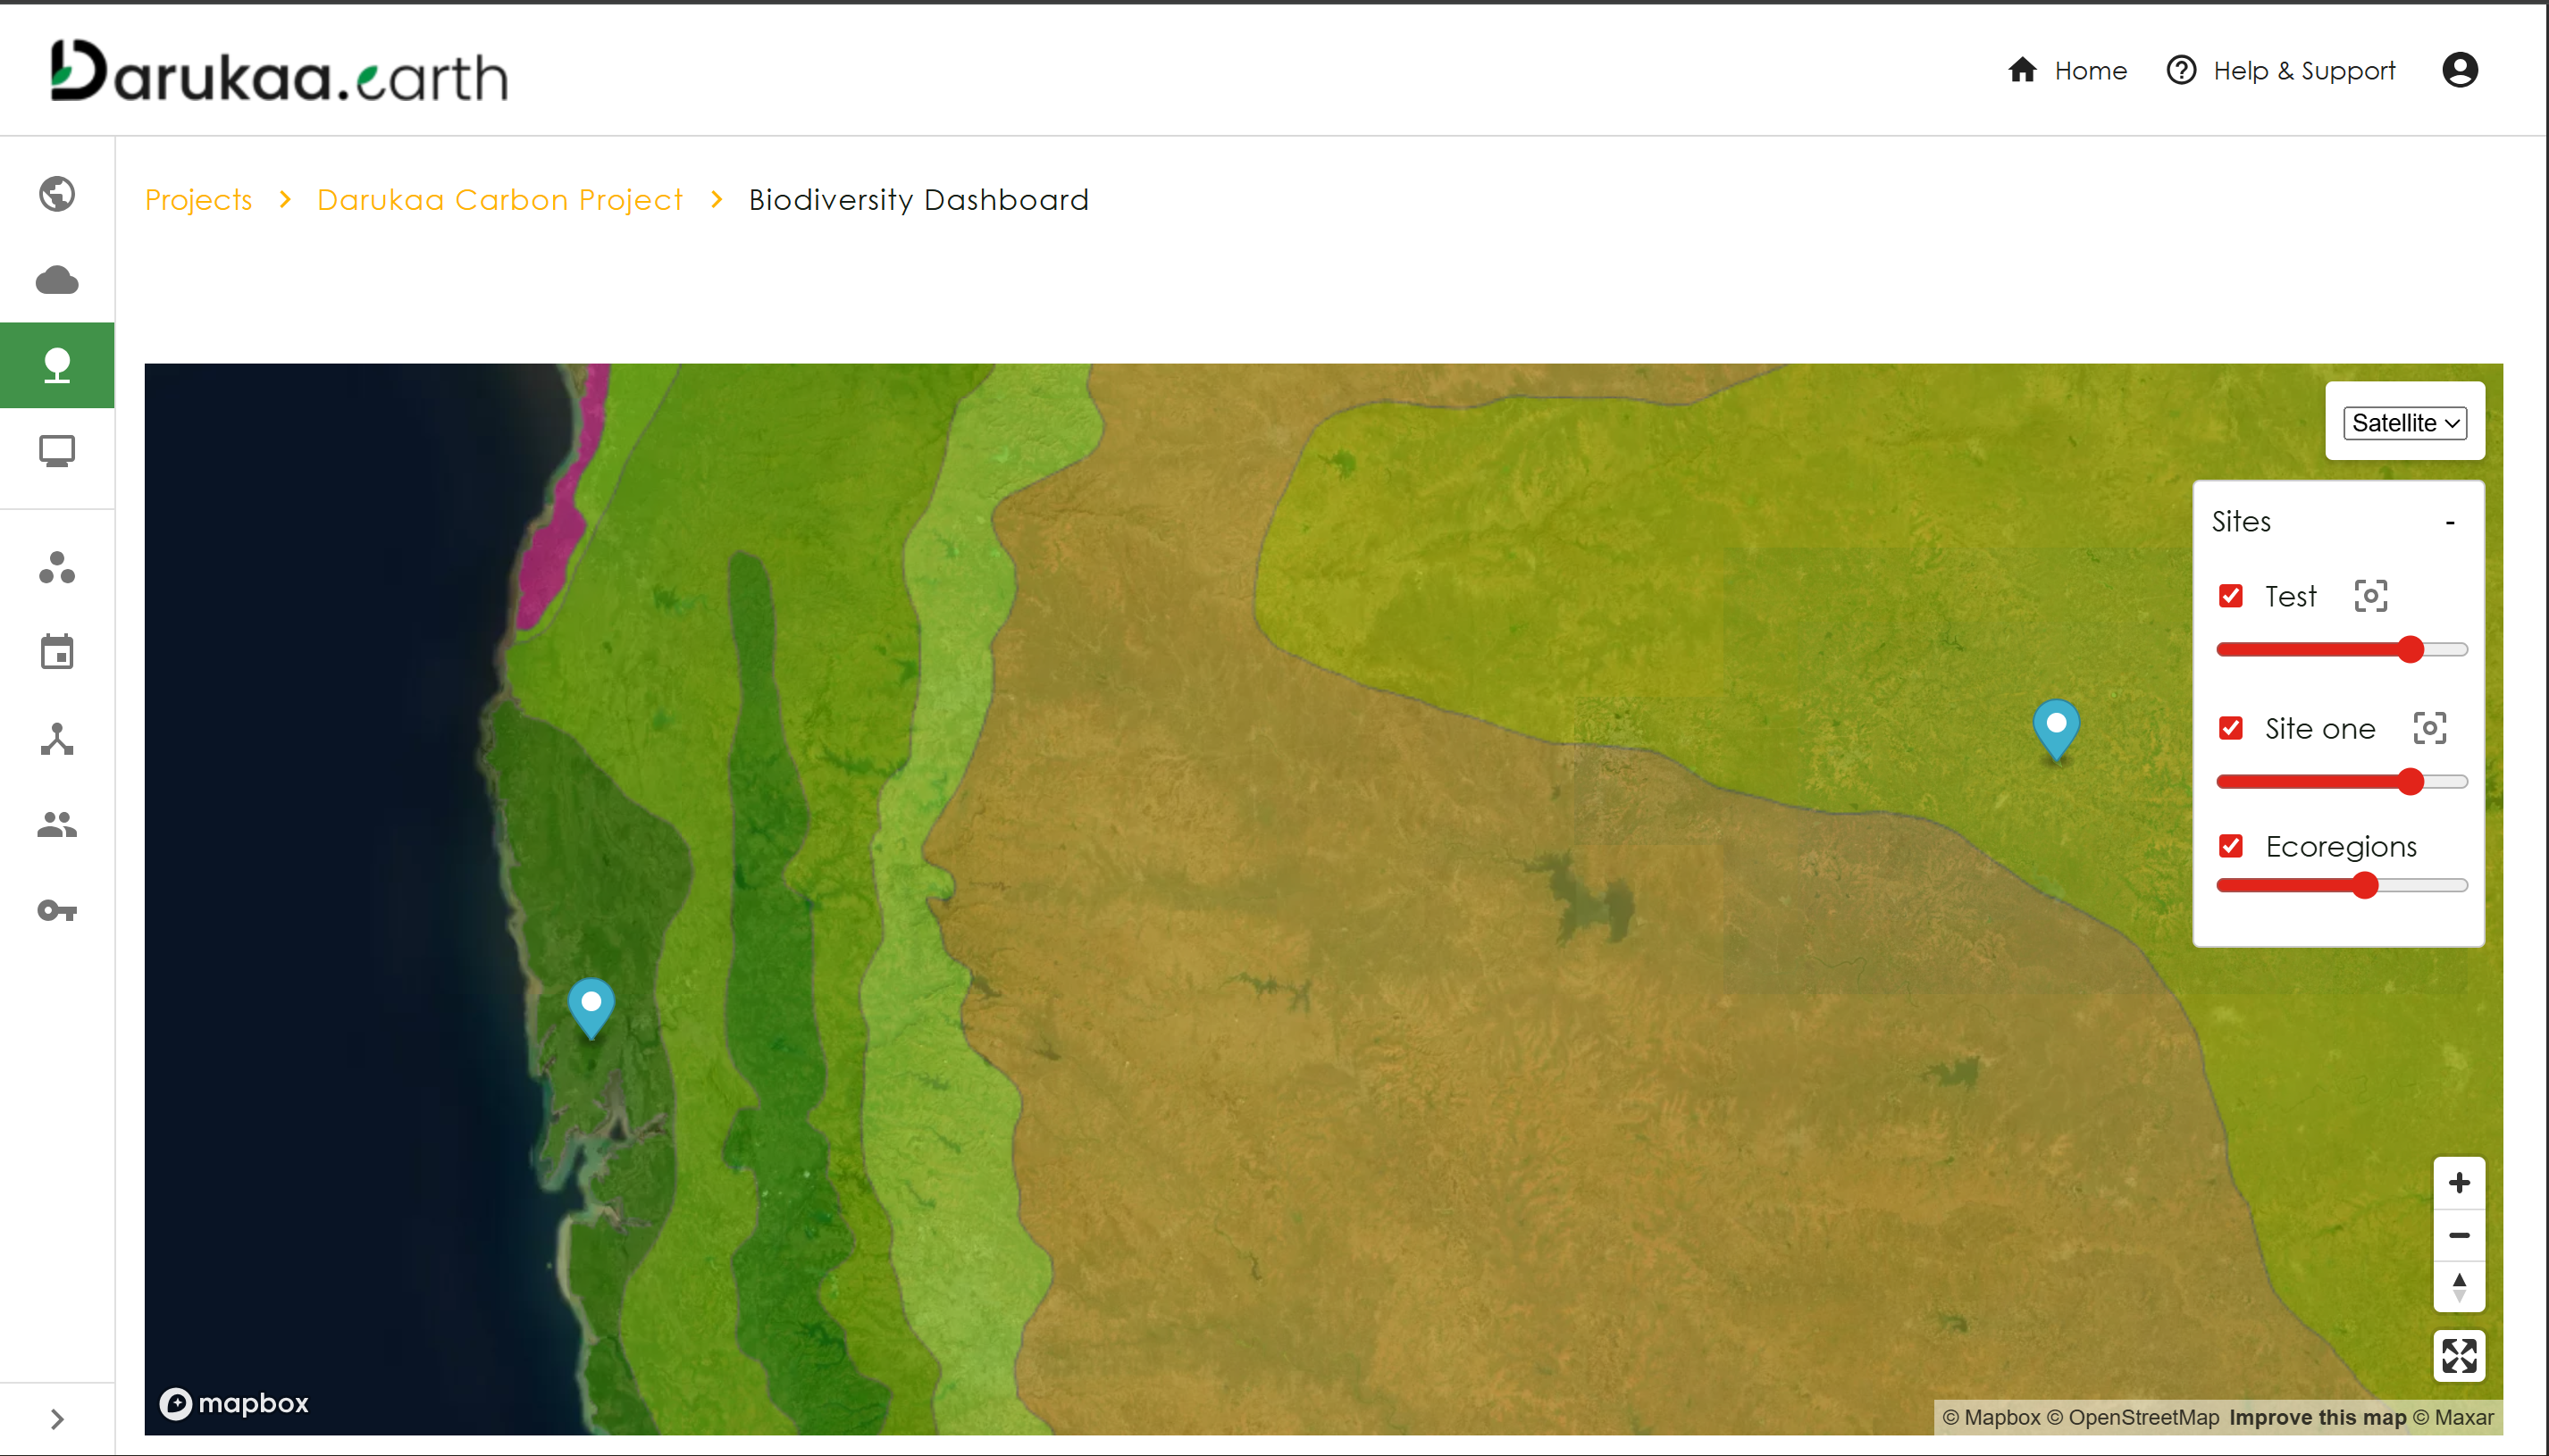
The Biodiversity Dashboard offers deep insights into ecosystem health, species monitoring, and acoustic analysis. It utilizes multimodal data to track biodiversity metrics accurately.
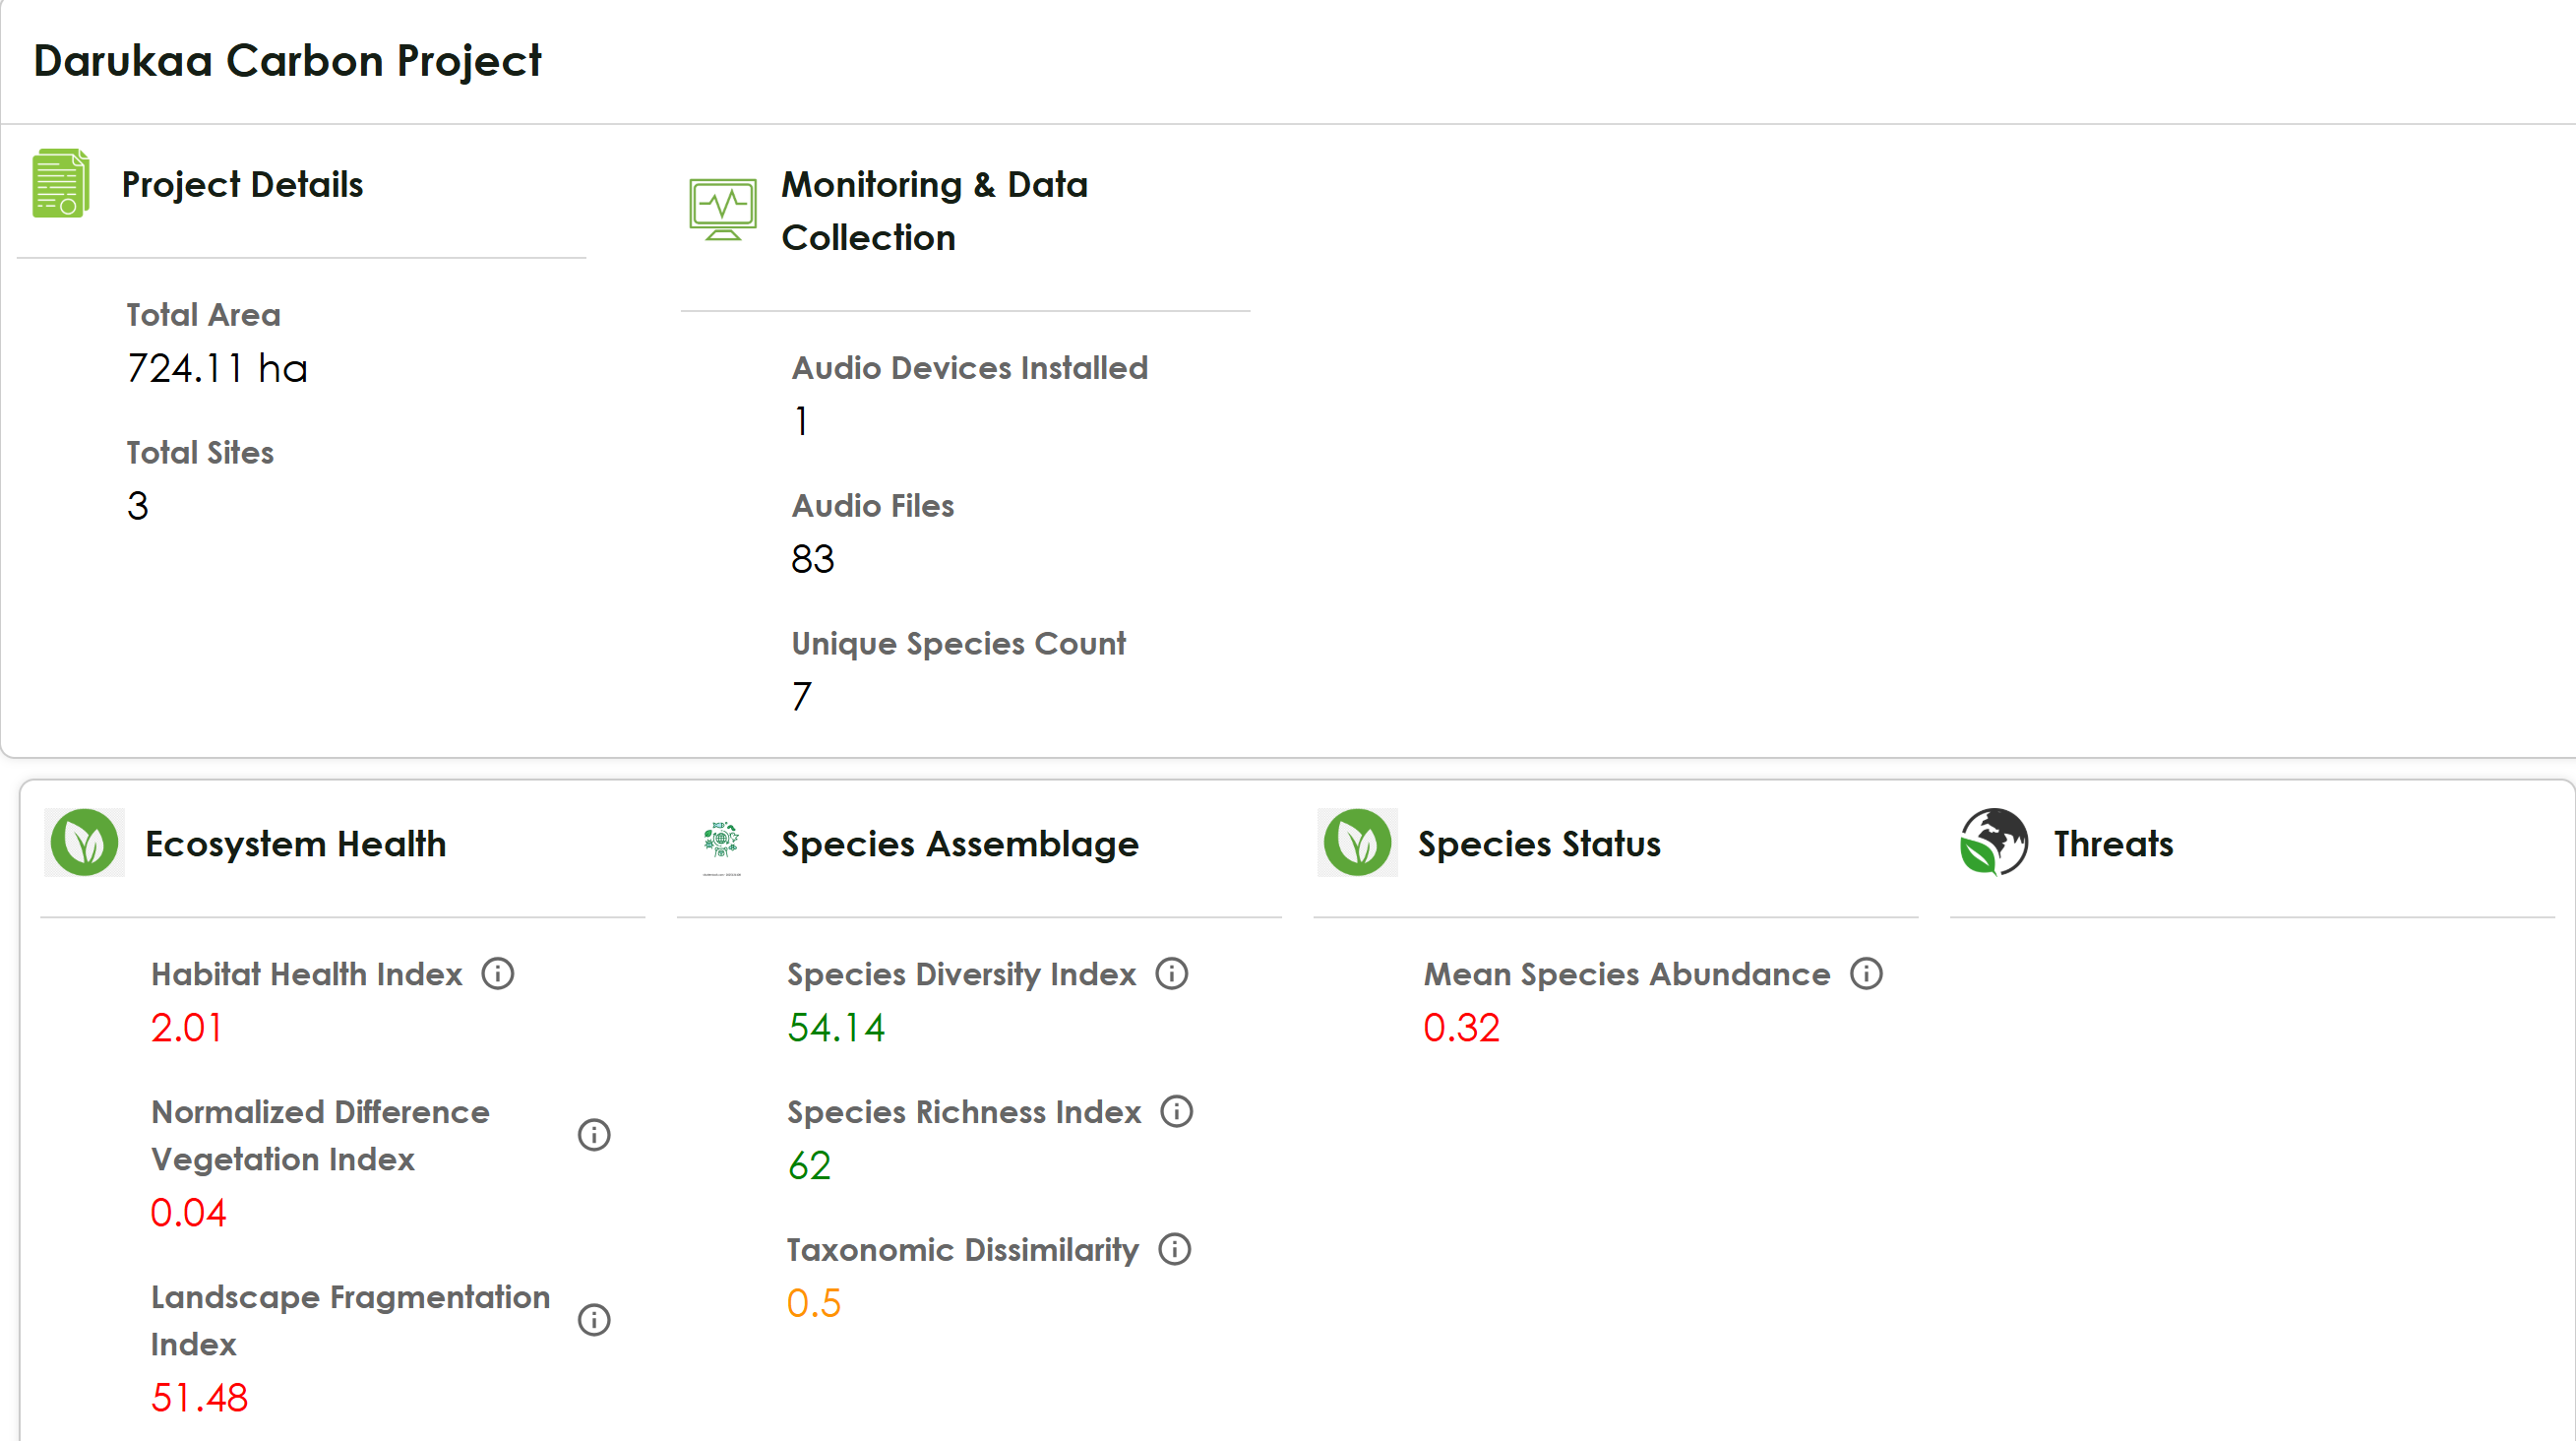
Data
Gain a high-level view of collected data metrics, including species richness, diversity indices, and device deployment statistics.
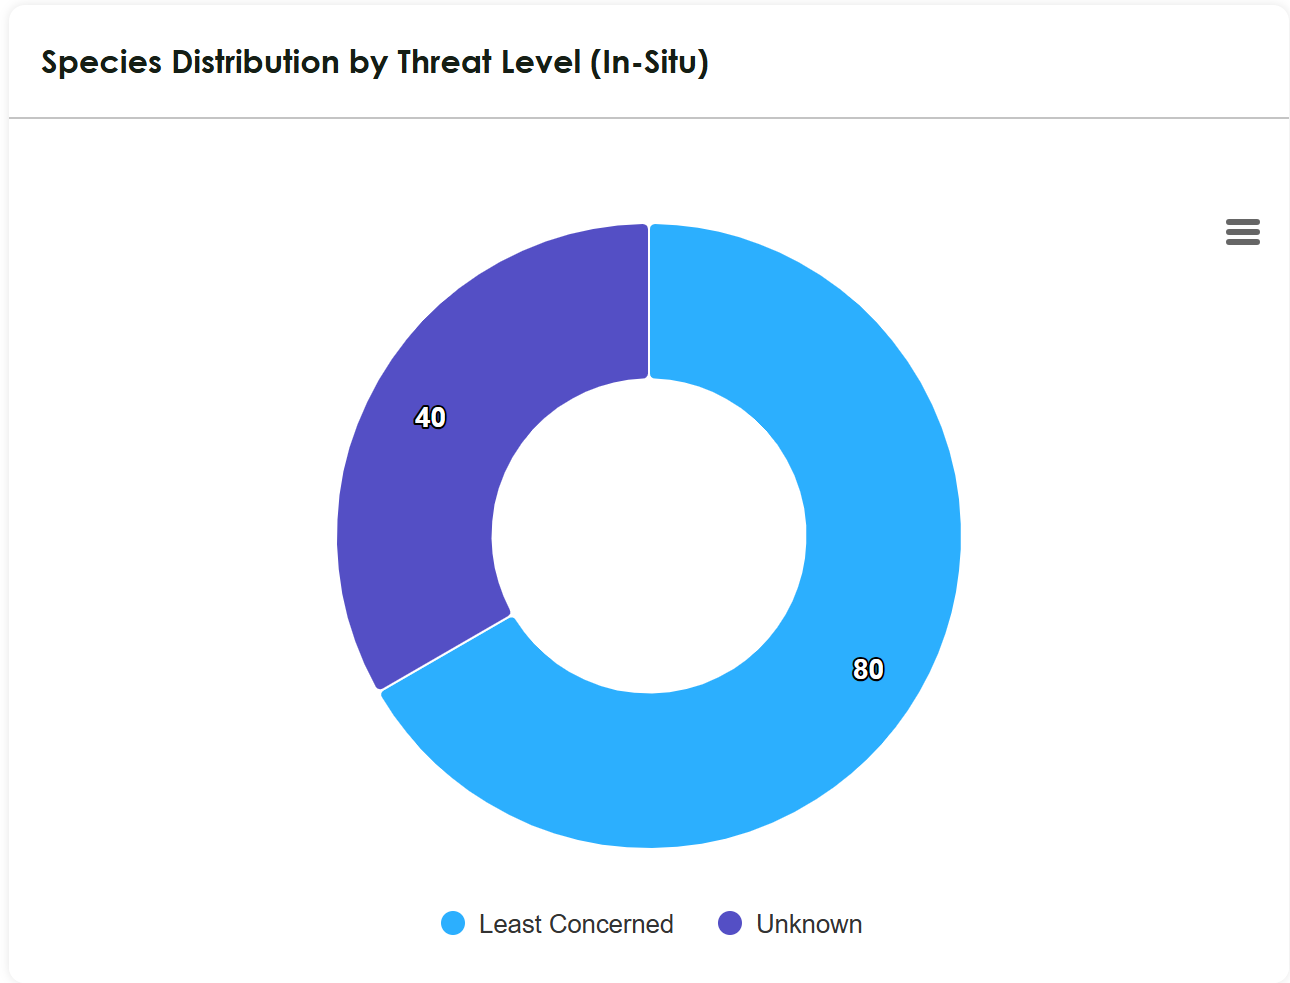
In-Situ Distribution
Analyze the spatial distribution of species observed directly within the project site (in-situ), helping to understand local habitat utilization.
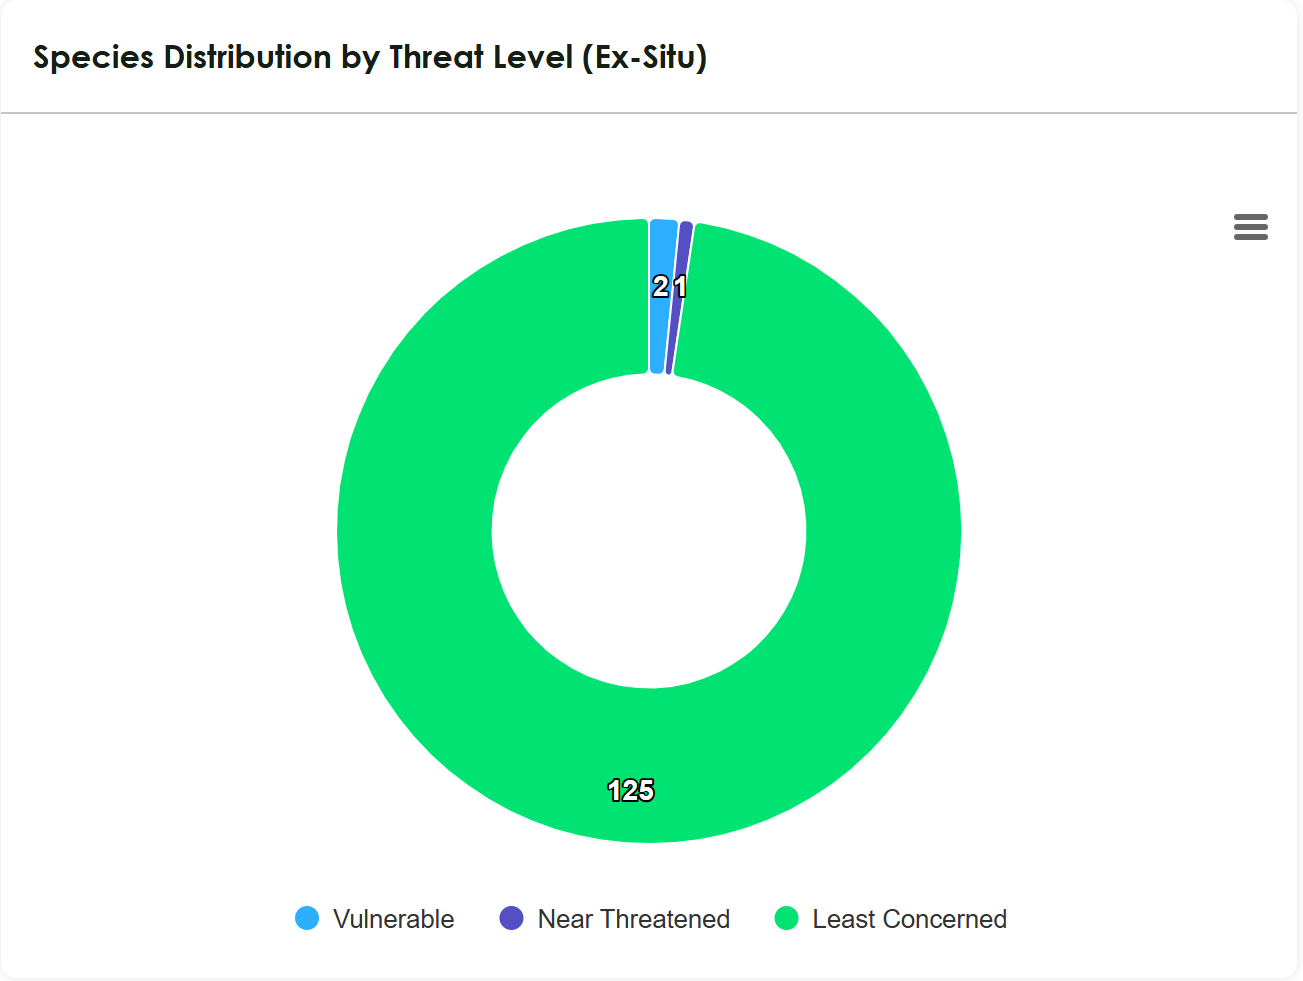
Ex-Situ Distribution
Track ex-situ conservation efforts and species data collected outside their natural habitats to support broader biodiversity goals.
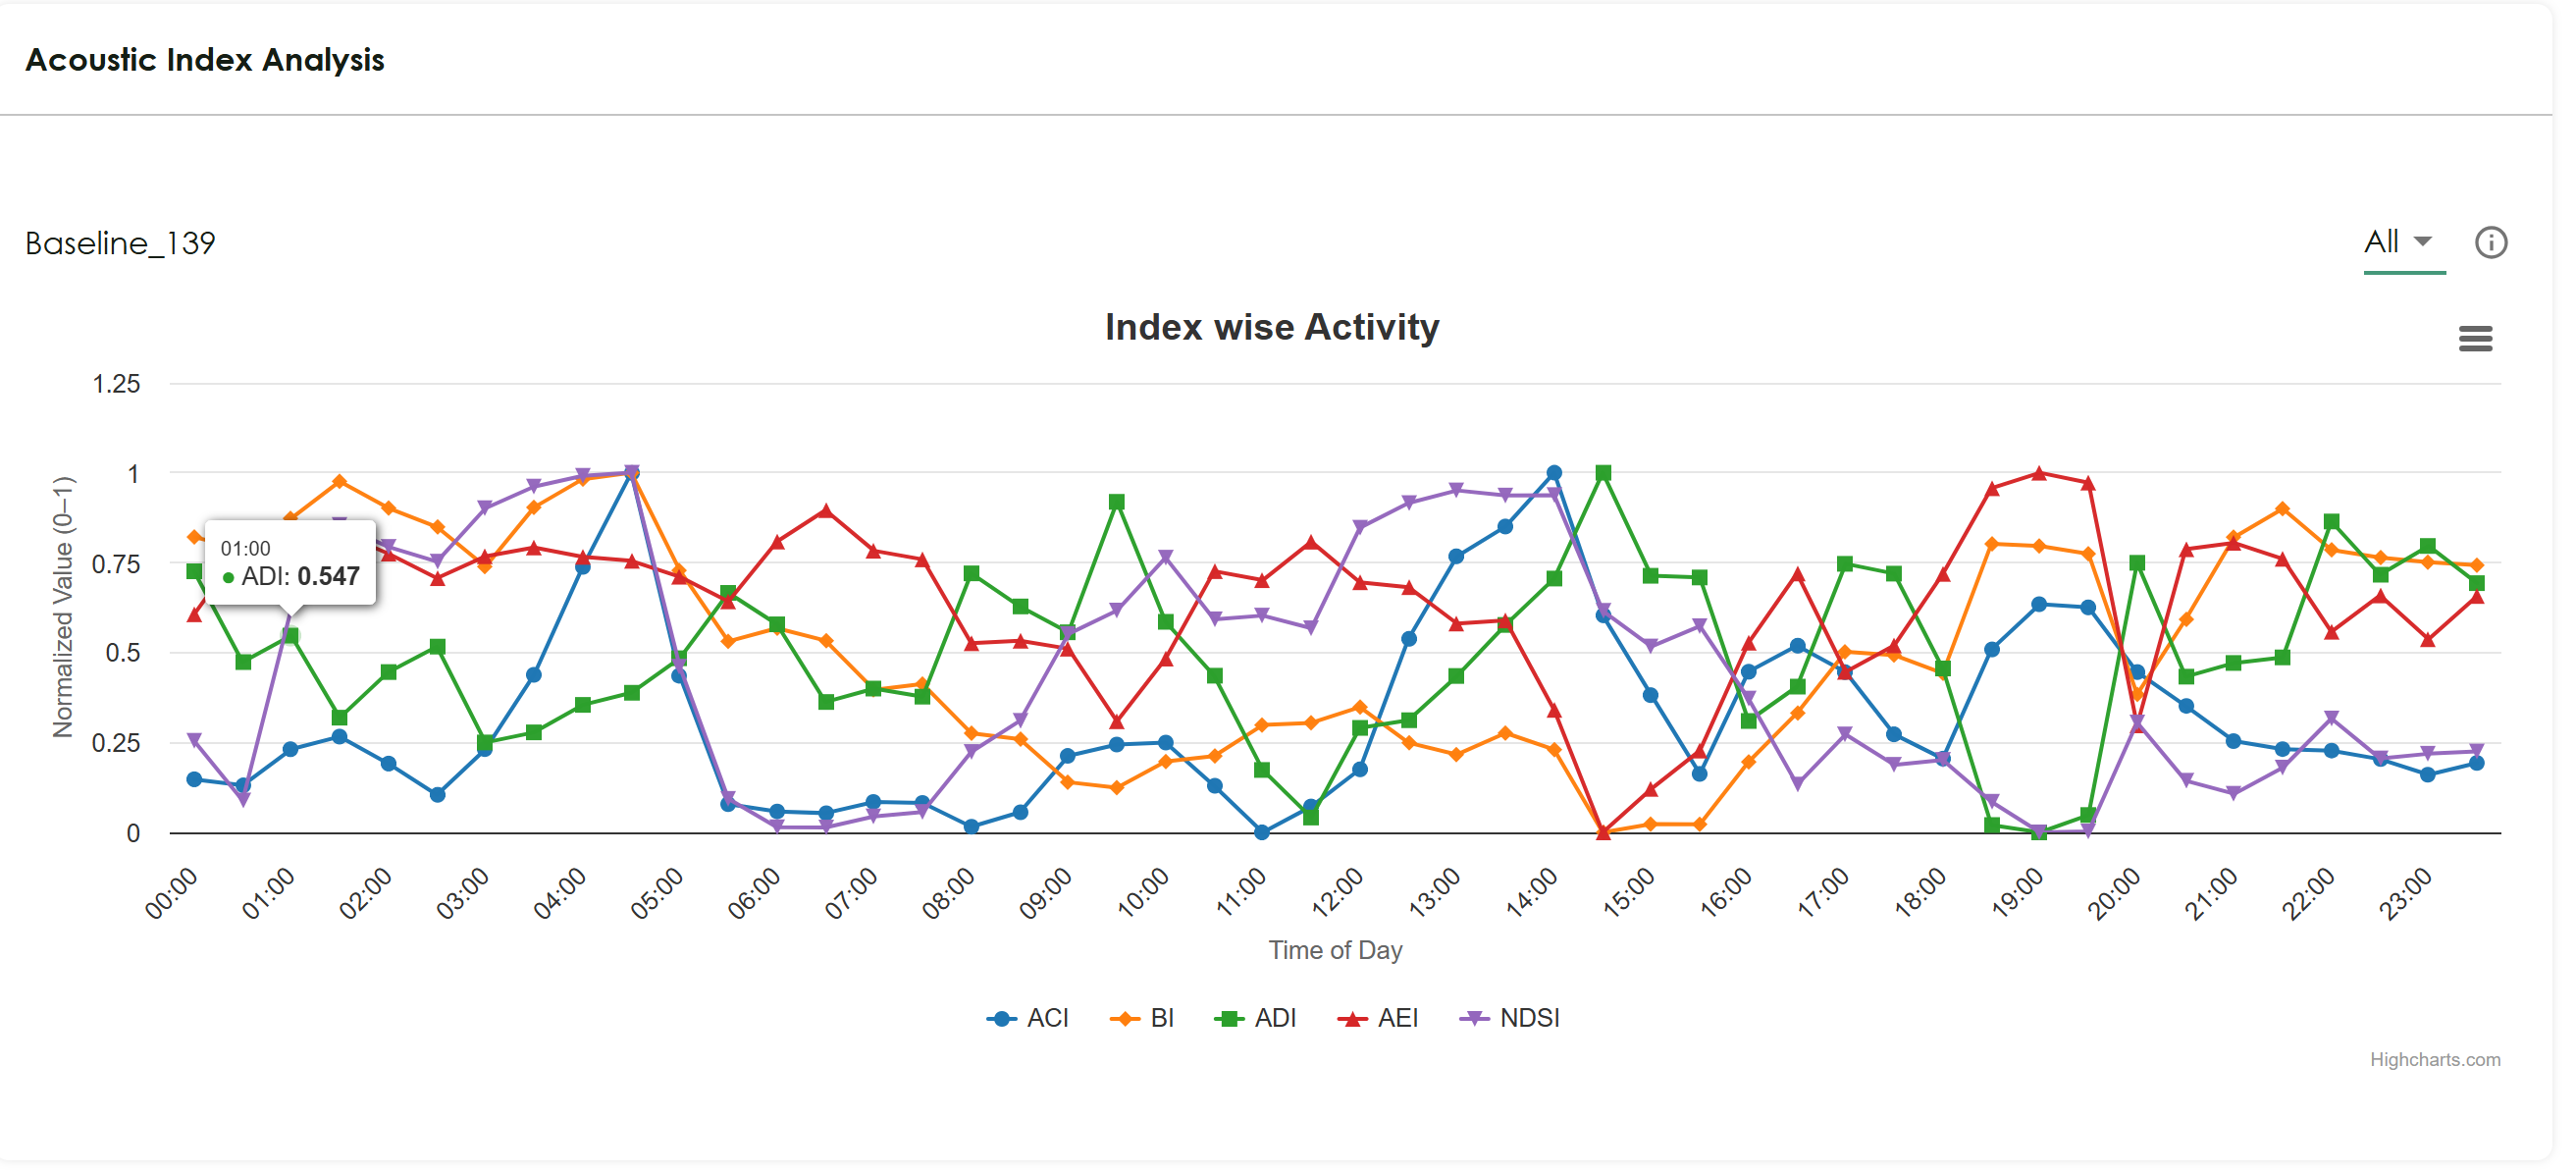
Acoustic Index Analysis
Leverage eco-acoustics to monitor biodiversity. The acoustic indices provide a proxy for ecosystem health based on soundscape analysis.
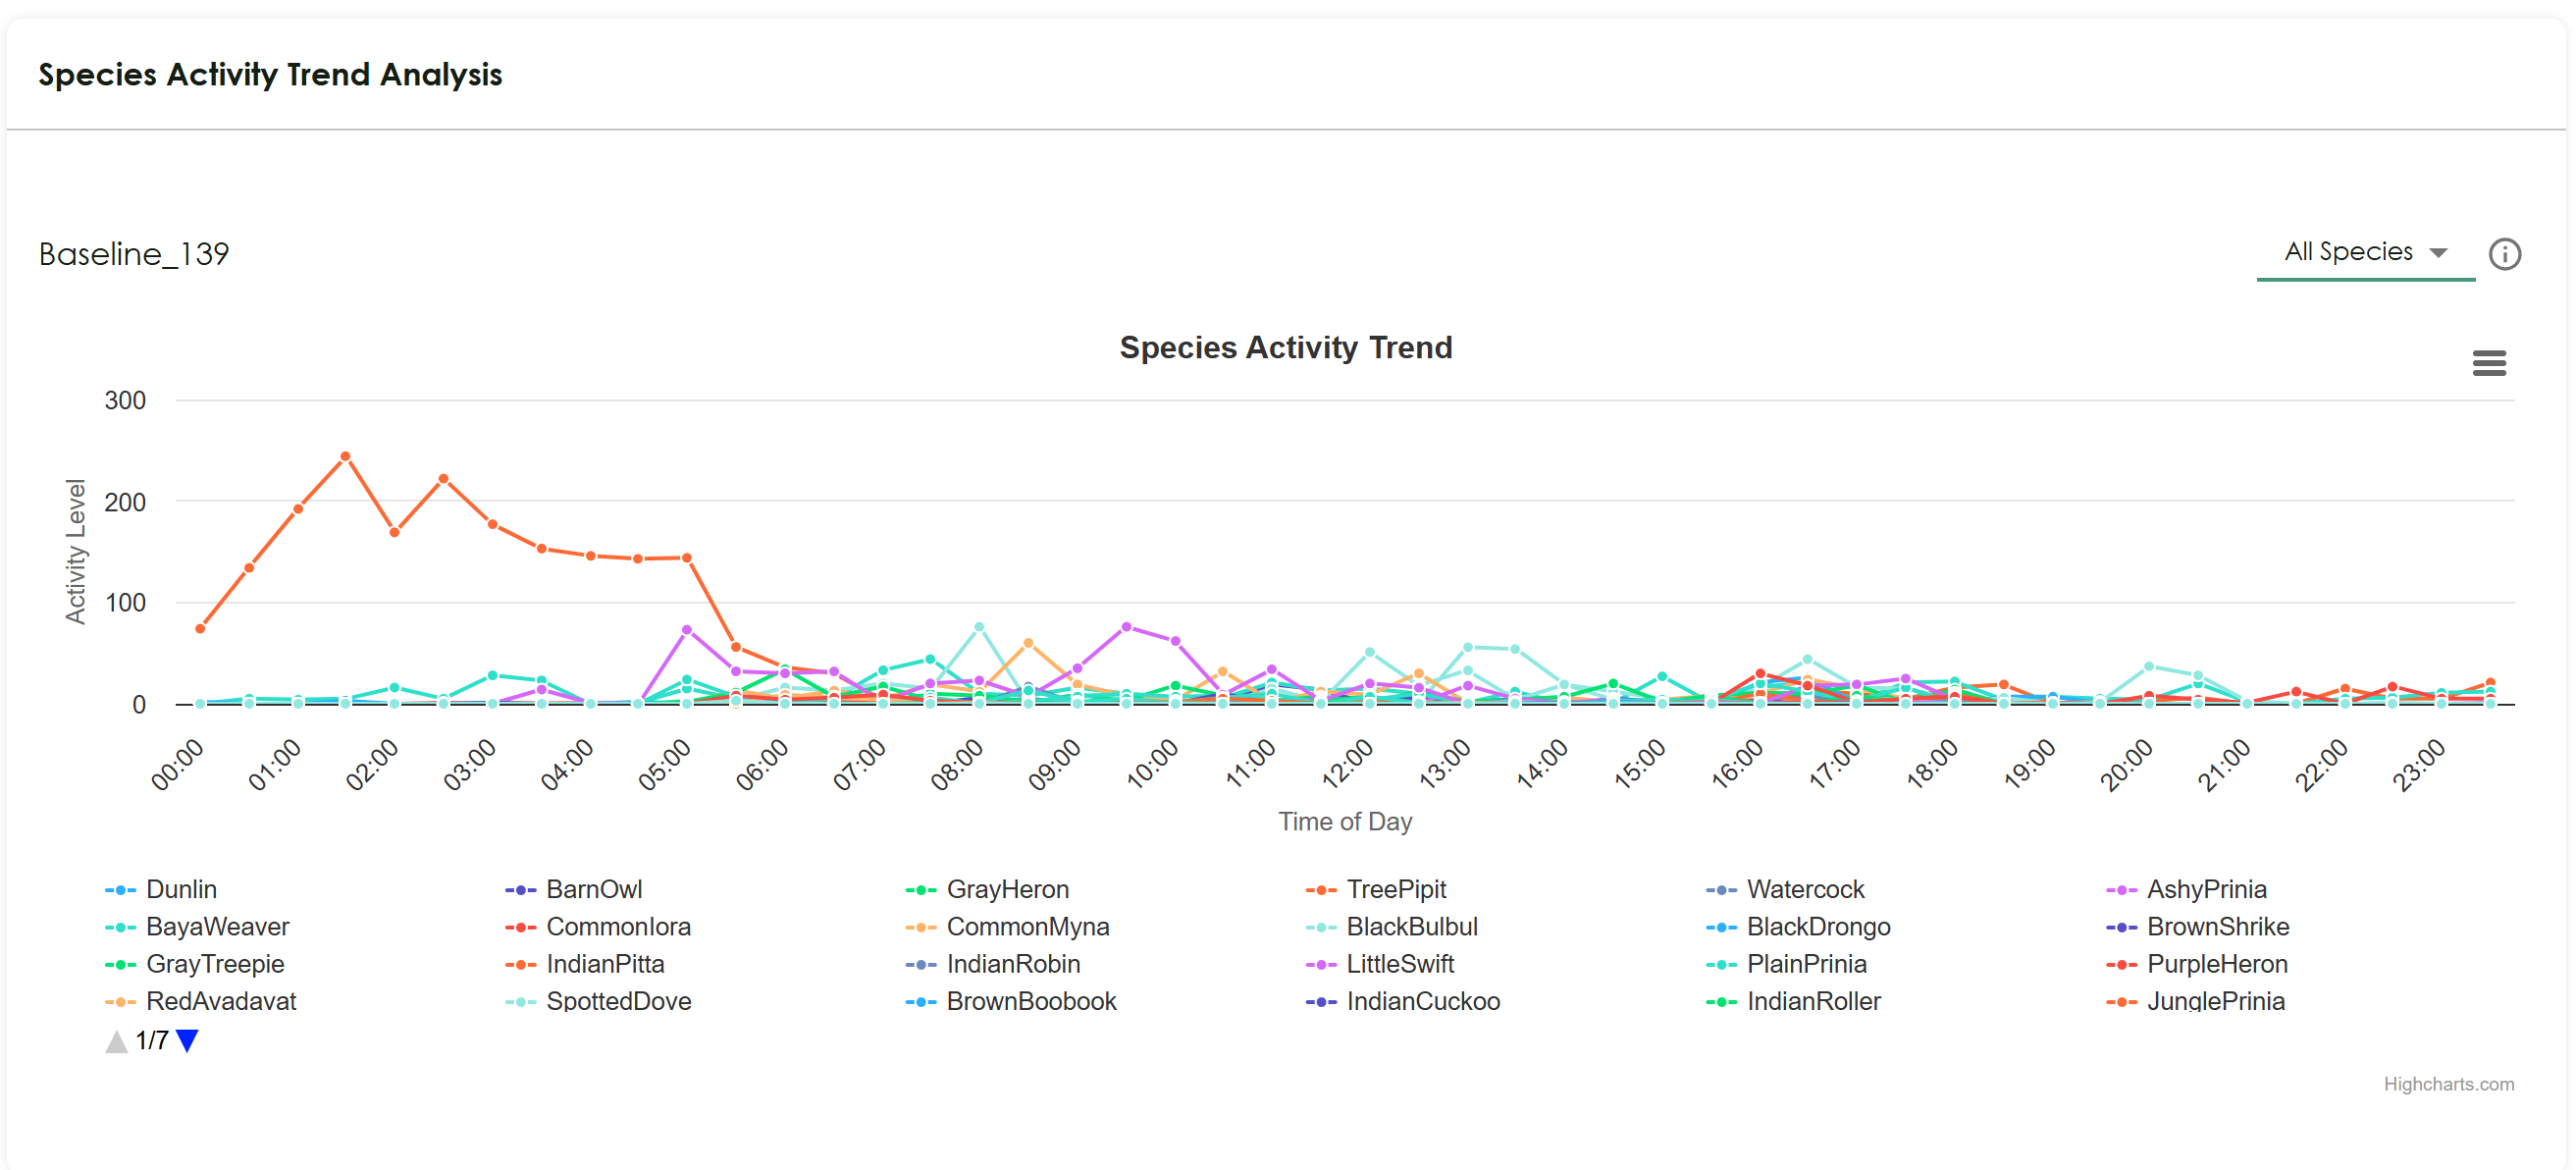
Species Activity Trend Analysis
Monitor how different species' activity levels change over time and across seasons, providing valuable insights into behavioral patterns and population dynamics.
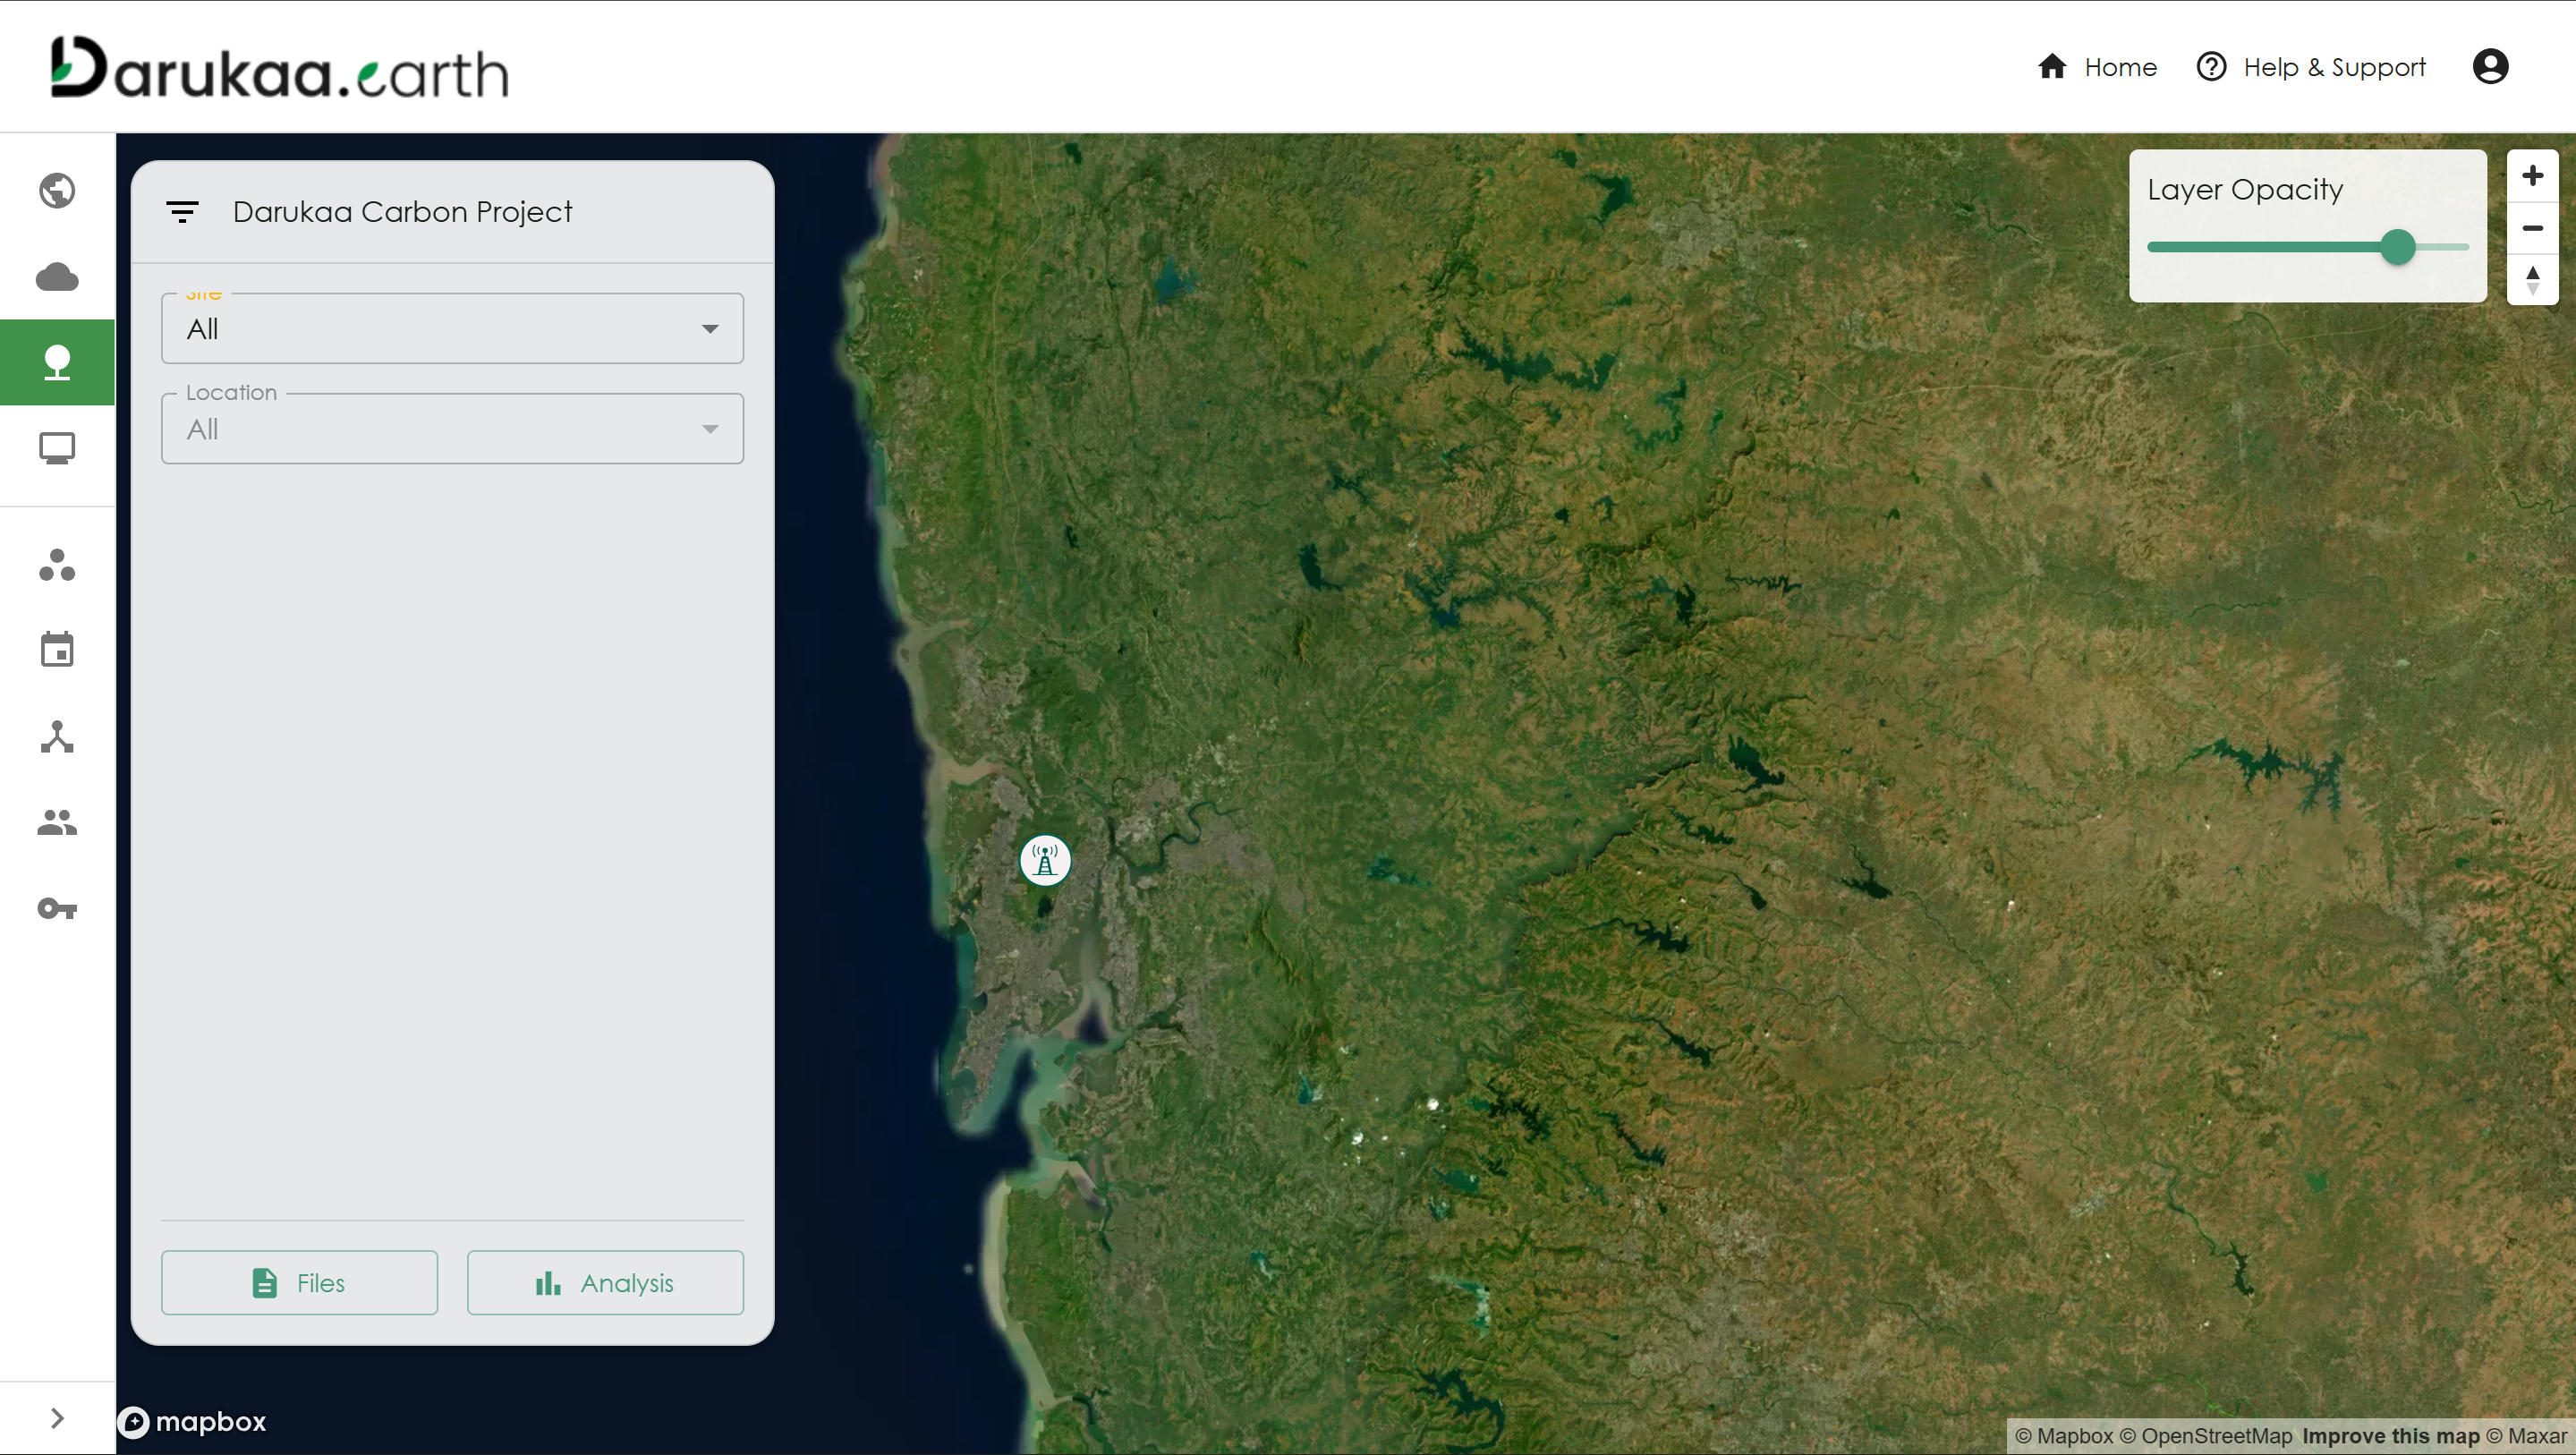
Biodiversity Map View
Visualize biodiversity data geospatially. The map view allows you to see the exact locations of acoustic sensors, camera traps, and field observations, along with spatial distributions of different species across your site.
Climate Dashboard
The Climate Dashboard helps assess and visualize long-term physical climate risks to your project sites under various emission scenarios.
Key features include: - Risk Assessment: View overall risk scores and severity categories. - Scenario Planning: Analyze risks under different RCP (Representative Concentration Pathway) scenarios. - Hazard Metrics: Track specific hazards like heat stress, drought severity, and flood risks. - Sector Analysis: Review risk breakdowns by specific sectors. - Value at Risk: Quantify potential financial exposure to climate hazards.
Next Steps
- API Access - Integrate dashboards with external systems